
The Federal Reserve’s most recent meeting ended … again … with hints that monetary policymakers would soon raise their target for the federal funds rate. In fact, many observers believe that an inevitable rate increase merely had been delayed until after the Presidential election. These observers cite repeated statements by Fed officials expressing satisfaction that the central bank has achieved both aims of its dual mandate: maximum employment and stable prices. If monetary policy actions affect the economy through an exploitable Phillips Curve – a systematic tradeoff between unemployment and inflation – then a tightening can be rationalized as a step to prevent inflation from overshooting its long-run target.
A Phillips Curve perspective, however, is not the only framework for evaluating Fed policy and the economy’s performance. Another view looks at the output gap and, as we show below, by this measure it is far less clear that monetary policy is excessively accommodative. With unemployment and the output gap sending conflicting signals, how should the Fed and its observers judge the stance of monetary policy? Measures of money growth, overlooked or misunderstood in nearly all recent analyses, provide valuable information in deciding whether an interest rate increase is premature or overdue.
Our first figure below plots the output gap in the United States, computed as the logarithmic, or percentage point, difference between real GDP and the Congressional Budget Office’s latest estimates of potential output. The graph shows, for example, that output was far below potential at the end of the severe 1981-82 recession but that the gap from potential had largely closed by 1985. Similar, albeit less extreme, output gaps opened and then closed following the recessions of 1990-91 and 2001.
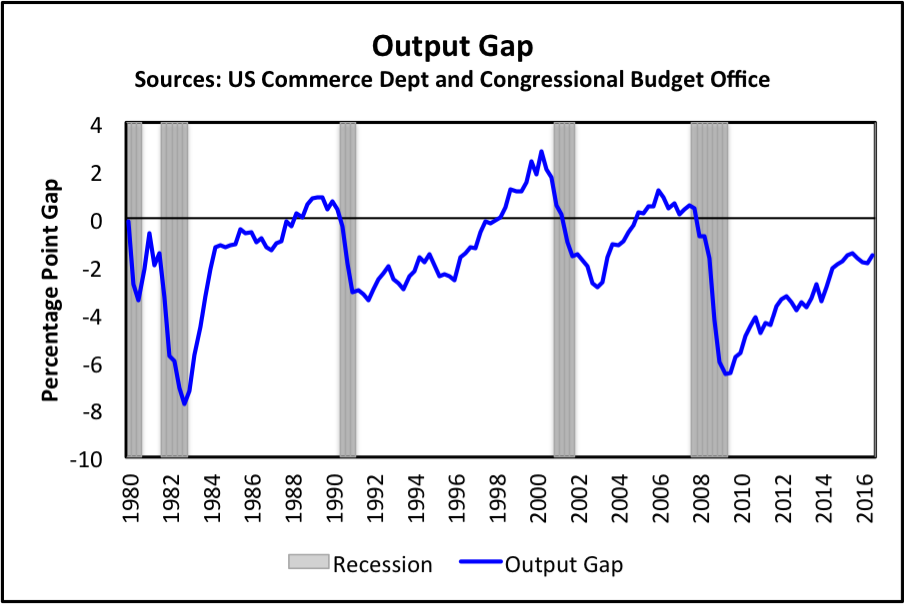
The most recent recovery, however, appears to have followed a distinctly different pattern. Seven years after the recession’s trough, real GDP remains well below potential. Moreover, since 2010, real GDP itself has growth at an average annual rate of just 2.1 percent. Since this is only slightly faster than the CBO’s current estimate 1.9 to 2.0 percent for the U.S. economy’s long-run growth potential, how is it that the output gap has shown any improvement at all? A deeper look at the data used to construct the graph shows that this is only because the CBO has lowered its estimates of potential GDP growth since 2010 even further, to just 1.4 percent per year. These statistics help remind us that, despite the decline in unemployment from 10 to 5 percent emphasized by believers in the Phillips Curve, the economic recovery has been, and remains, unusually erratic and disappointingly slow.
Since the unemployment rate and output gap are giving conflicting signals about the true strength of the U.S. economy, how can Fed officials judge whether it’s time to raise interest rates once again? Additional evidence can be found by looking more directly at the consequences of the Fed’s own actions, reflected in the behavior of the monetary base. As commonly interpreted, the nearly five-fold increase in the base brought about through multiple waves of quantitative easing indicates that monetary policy has been highly expansionary throughout the recession and subsequent recovery. Missing from this interpretation, however, is recognition that the high level of excess reserves now held within the banking system is also a consequence of the Fed’s new policy of paying interest on reserves. As a safe and liquid asset in an environment of low interest rates, banks now willingly hold those reserves instead of using them to make new loans. This shift in reserves demand mitigates the stimulative effect of the increased supply of base money.
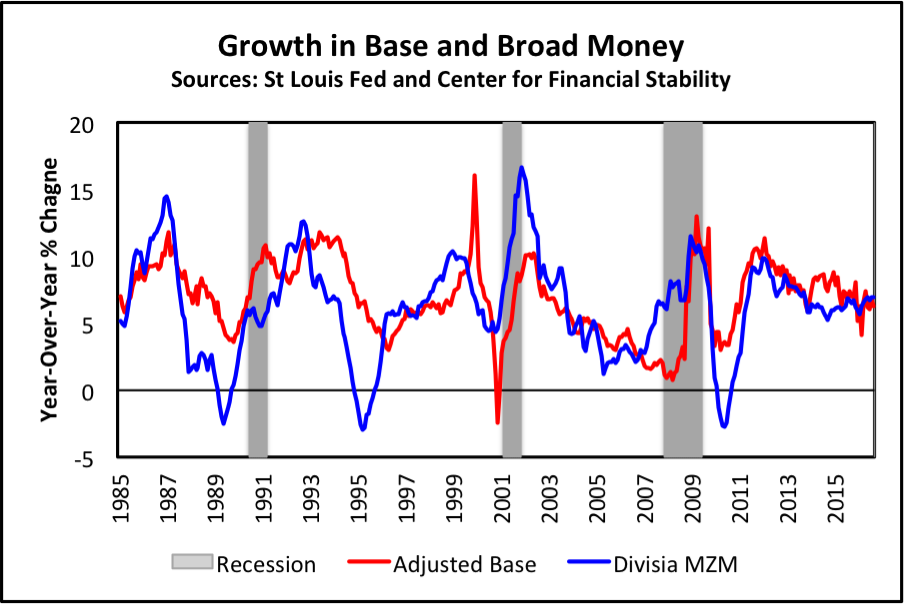
Our second figure, therefore, plots an adjusted measure of monetary base growth suggested by John Tatom, which subtracts excess reserves. This measure of adjusted base growth behaves consistently before, during, and since the financial crisis and, by accounting for changes in excess reserves demand, reflects more accurately the net effects of quantitative easing over the most recent period. This same graph compares the behavior of growth in the adjusted monetary base to that of the broader, Divisia MZM monetary aggregate to show that these alternative measures of monetary expansion have behaved quite similarly, historically and more recently. In particular, both narrow and broad measures of money growth have slowed noticeably since the beginning of 2012: the adjusted monetary base from 11 to 6 percent and Divisia MZM from 10 to 7 percent per year.
These monetary data should reassure Fed officials and outside observers that, from a Quantity Theory perspective that associates inflation with money growth, monetary policy has tightened significantly as quantitative easing ended in 2013 and the Fed began to move interest rates higher last year. From this perspective, which deserves greater emphasis inside and outside the Fed, policy appears reasonably balanced – appropriately but not excessively accommodative – even as it stands now.
Michael Belongia is a professor of economics at the University of Mississippi. Peter Ireland is a professor of economics at Boston College and a member of the Shadow Open Market Committee.
Interested in real economic insights? Want to stay ahead of the competition? Each weekday morning, e21 delivers a short email that includes e21 exclusive commentaries and the latest market news and updates from Washington. Sign up for the e21 Morning eBrief.