
Recently, we commented on how newly released government data allows us to make a rough estimate of the gap between New York City’s past decade of rapid employment growth and its relatively modest housing growth, and how this gap reflects a “jobs–housing mismatch.” San Francisco is in a very similar position to New York. In the same manner, its housing crunch is fundamentally a consequence of being a magnet for job-creating businesses while limiting new housing through restrictive land-use regulations.
The California Employment Development Department recently released annual average employment data for 2019 for the Metropolitan Division comprising San Francisco and San Mateo Counties (the former is coterminous with the city of San Francisco and the latter, its southern suburbs). Combining this data point with earlier years, the two counties have increased total nonfarm employment by about 30 percent over the previous business cycle peak in 2008.

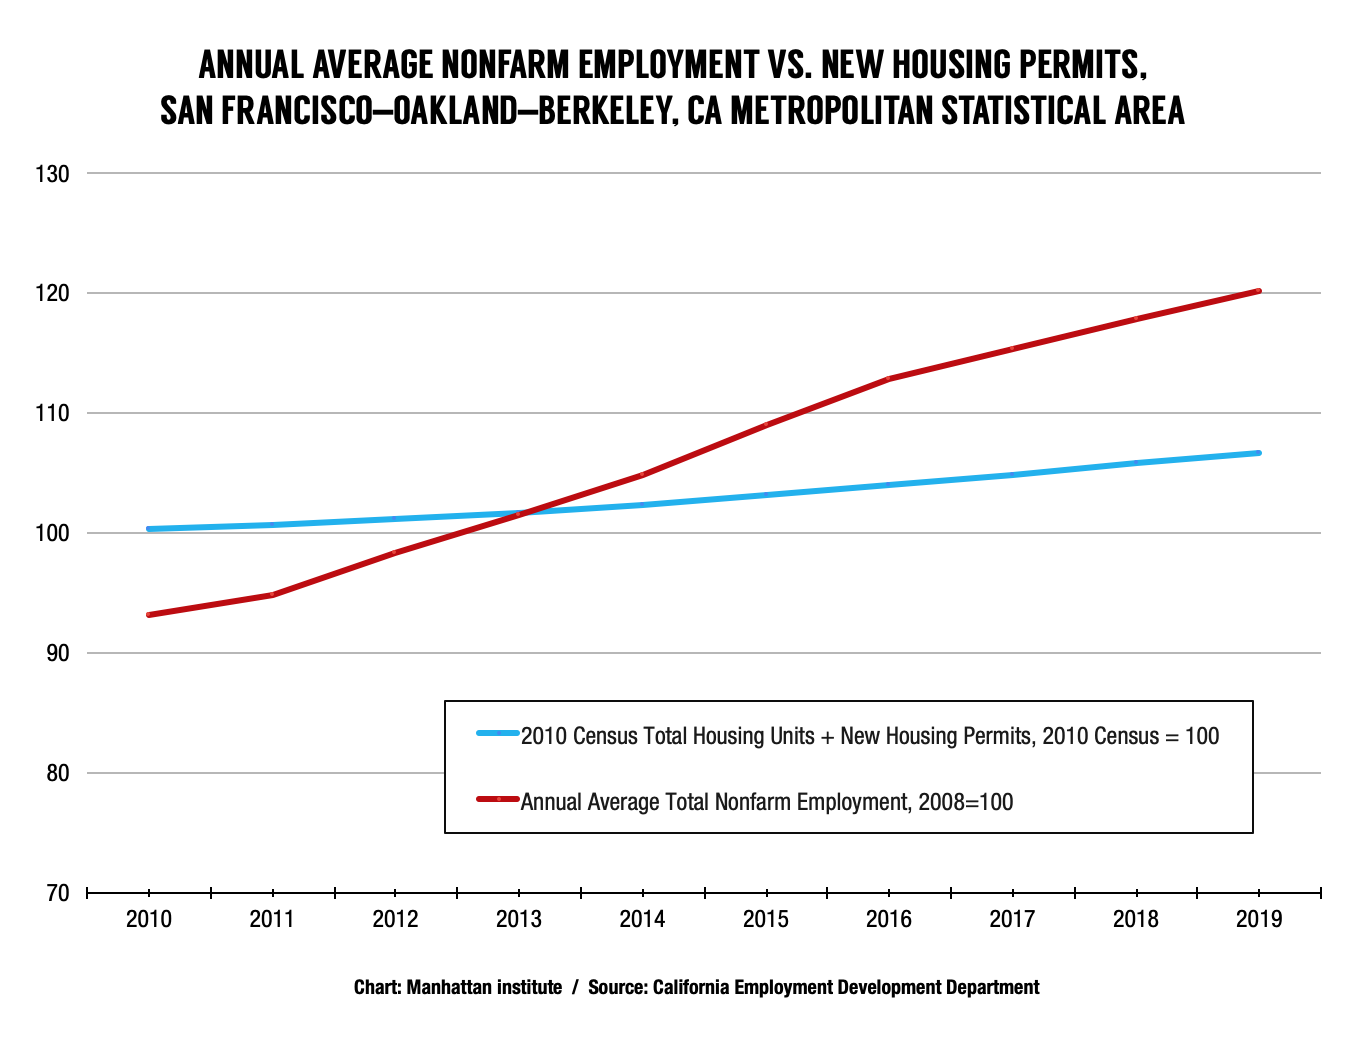
Chart 1 above compares the increase in annual average nonfarm employment for the two counties from 2010 to 2019, with the number of building permits issued for new housing units. The employment series uses the number of jobs at the last business cycle peak, 2008, as a base year, while the building permits series uses the last census year of 2010.
By 2019, annual average nonfarm employment had increased by 277,100, from 901,000 in 2008 to 1,178,100. In contrast, the U.S. Census Bureau recorded a total of 45,122 permits for new housing units from 2010 to 2019, representing just a 7 percent increase over the 2010 census base of 647,973. The ratio of new jobs to new housing permits over the decade was over 6 to 1.
The data look less stark, but still indicative of a housing shortfall, when the three Metropolitan Divisions comprising the San Francisco–Oakland–Berkeley Metropolitan Statistical Area (MSA) are combined. The MSA adds Alameda and Contra Costa Counties across the bay from San Francisco as well as Marin County to the north. As shown in chart 2, in the MSA as a whole, annual average nonfarm employment rose by about 20 percent, from 2,063,200 in 2008 to 2,480,300 in 2019. The 117,168 new housing permits over the 2010–2019 decade also represented about a 7 percent increase over the 2010 census base of 1,741,999. The ratio of new jobs to new housing permits over the decade was 3.6 to 1.
The reason for the relatively better picture regionally is that Alameda County, which includes the city of Oakland, had 47,874 permits over the decade, more than San Francisco and San Mateo combined. This represented 8.2 percent of the 2010 census count of housing units (582,549). In contrast, Alameda and Contra Costa Counties, combined in the Oakland Hayward Berkeley Metropolitan Division for data-collecting purposes, gained only about 130,000 jobs by 2019 over the 2008 peak of 1,054,800, or 12.3 percent. Thus, San Francisco’s eastern suburbs achieved a much better balance of jobs and housing growth and, in doing so, offered relief to San Francisco.
In the 2006–10 period, according to the U.S. Census Bureau, only about 56 percent of San Francisco workers lived in San Francisco. About 12 percent lived in Alameda County. It’s likely that when 2016–20 data become available, this number will be considerably higher. A 2019 report by the San Francisco Municipal Transport Agency found a 30 percent increase in Bay Area Rapid Transit (BART) riders entering San Francisco from 2010 to 2018, although this also includes passengers entering from the south as well as the East Bay.
The San Francisco–Oakland–Berkeley MSA abuts another MSA, San Jose–Sunnyvale–Santa Clara (comprised of Santa Clara County and the far less populous San Benito County), which is itself a major source of overlapping jobs–housing mismatch. The counties of Santa Clara—which is southeast of San Mateo and contains most of the communities known collectively as Silicon Valley—and San Benito had, by 2019, gained 214,500 jobs over the 2008 cyclical peak of 932,300, or 23 percent. In contrast, the two counties had 66,332 new housing permits, for a ratio of 3.2 jobs for each new housing unit. Housing growth in the abutting Alameda County is thus potentially also providing relief to Santa Clara as well as San Francisco.
The data on San Francisco city and regional jobs and housing growth provide context for the likely effects of Proposition E, approved by San Francisco voters in March 2020. Proposition E would limit the construction of new office buildings in San Francisco unless affordable housing goals were met. Since the city has not met these goals in the past, many observers expect that Proposition E will reduce construction of new office space in the future.
Proposition E is, in effect, an effort to solve the jobs–housing mismatch by creating fewer new jobs in San Francisco. Unfortunately, the mismatch already exists, based on past job growth. Some employment growth sectors, such as Educational & Health Services and Leisure & Hospitality, aren’t dependent on office space and won’t be affected by Proposition E. Moreover, the Bay Area’s other focal point of employment, Santa Clara County, also doesn’t produce enough housing to match its job growth. In the 2006–10 period, four out of five people who worked in Santa Clara County lived there. That percentage may be going down as not enough housing is getting built to accommodate job growth. This increases demand for housing in San Francisco itself and the suburban counties that have traditionally supplied its labor force.
Like New York City, the Bay Area may get a temporary respite from its housing crunch in 2020 as a recession cuts into job growth. However, in the longer term, it needs a regional housing solution that puts enough housing in appropriate locations to meet the demand created by its highly productive economy.
Eric Kober is an adjunct fellow at the Manhattan Institute. He retired in 2017 as director of housing, economic and infrastructure planning at the New York City Department of City Planning.
Interested in real economic insights? Want to stay ahead of the competition? Each weekday morning, e21 delivers a short email that includes e21 exclusive commentaries and the latest market news and updates from Washington. Sign up for the e21 Morning eBrief.
Photo by bluejayphoto/iStock